Dive into MLB's evolving performance metrics, including player usage strategies and game dynamics, shaping the future of baseball.
Analyzing Trends in MLB Performance
This section sets the stage for a deep dive into the key metrics shaping Major League Baseball (MLB) today. By focusing on aspects like scoring, the unconventional use of position players as pitchers, injury reports, stolen bases, game duration, and the Automated Ball-Strike System (ABS), we're looking at elements that could redefine how the game is played and understood.
The focus on these statistics isn't just for retrospective analysis; it’s about uncovering patterns that may impact the strategies teams employ. For anyone involved in baseball analytics or team management, knowing where runners are getting hurt or how long games are dragging on can help to inform decisions that lead to better performance both on and off the field.
What’s particularly striking is the burgeoning trend of position players taking the mound in high-pressure situations—a situation you’d expect to tilt the balance of a game, but it’s happening more frequently. This brings us to the Automatic Ball-Strike System. There’s a significant conversation happening around whether this technology can enhance the fairness of the game or if it detracts from the human element that fans cherish.
As we track these developments month by month, we can uncover insights that will not only help fans understand the game better but also offer coaches and players a more detailed blueprint for improvement. Keep a close eye on how these metrics evolve—what they reveal might be more impactful than you think.
Overview of Current Standings
The latest standings paint a vivid picture of the current state of play across Major League Baseball. With thirty teams competing fiercely, the competition is tighter than ever. Out of these, just nine have managed to secure a winning record, reflecting the challenges teams face as the season progresses.
In the National League West, the Padres and Dodgers lead the pack with identical records of 18 wins and 6 losses, but the Padres hold the edge with a higher winning percentage of .750 compared to the Dodgers' .720. The Diamondbacks are trailing somewhat behind at 13-10 (.565), while the bottom of the division sees the Giants and Rockies struggling at 8-16 (.333) and 6-18 (.250), respectively.
Turning to the National League Central, the Brewers parallel the Padres with a 18-6 record and .750 winning percentage. However, the Pirates are close behind at 15-9 (.625), suggesting a more competitive chase for the division title. Meanwhile, the Cubs, Reds, and Cardinals are floundering, each carrying records that imply considerable rebuilding or adjustment is necessary before they can compete consistently.
In the National League East, competitiveness is even more diluted. The Braves, Mets, and Nationals are locked in a three-way tie, each standing at 12-12 and holding a .500 percentage. The Marlins and Phillies are also teetering on the edge of mediocrity, with records of 11-11 and 10-14, respectively. None of these teams are distinguishing themselves, raising questions about their potential playoff viability.
Switching to the American League, the narrative continues similarly across the divisions. In the AL West, the Rangers and Mariners stand even at 12-12, each with a .500 record, while the A’s and Astros hover around .458. The Angels sit at the bottom, significantly off the pace with only nine wins against 15 losses.
The AL Central appears slightly more competitive with the Guardians leading with a 16-9 record (.640). The Tigers follow at 13-12 (.520), but the White Sox, Twins, and Royals struggle to stay relevant in the playoff conversation, with just .480 and .292 records, signaling the need for immediate strategy changes.
Finally, in the AL East, the Yankees are leading with a commendable .652 win percentage. The Rays are a close second at .640, but as you dive deeper into the numbers, the Red Sox, Blue Jays, and Orioles are all grappling with underwhelming performances.
Is Competitive Balance Achievable?
The statistics lead us to a striking observation: as thrilling as these races are, they simultaneously underscore a worrying trend—half of last year's playoff teams are failing to outperform the .500 mark now. Is this what analysts refer to when discussing the need for better competitive balance? The data might suggest some teams are simply unable to maintain their edge, while others are still trying to figure out how to put it all together. In an environment where only a few teams consistently dominate, this might be a crucial moment for front offices to rethink their strategies, roster constructions, and overall competitiveness. What’s clear is that if the current pace continues, teams will need to adapt quickly to avoid being left behind.
Reflexiones sobre Septiembre de 2026
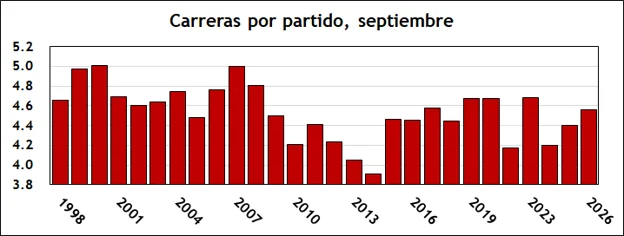
Septiembre 2026 fue, sin duda, un mes atípico en términos de anotación. Aunque históricamente es conocido por su escasa producción ofensiva —con un promedio de 4.54 carreras por partido desde 1998— este año se observó un ligero aumento con 4.56 carreras por encuentro, lo que lo coloca en el segundo lugar de este año, solo superado por junio. Sin embargo, eso no le da carta blanca para considerarlo un mes excepcional; al contrastar este dato con el rendimiento de años anteriores, simplemente se posiciona en el medio de las estadísticas de las últimas 28 temporadas.
Lo verdaderamente interesante de septiembre no son solo las cifras brutas, sino cómo estas se desglosan. Un aumento en 4.56 carreras por partido es notable, pero cuando se analiza más de cerca, el rendimiento en las primeras nueve entradas muestra una imagen menos impresionante. Los lanzadores permitieron un total de 3,176 carreras en más de 6,300 entradas lanzadas, lo que sugiere que, por más anotaciones que veamos, no todo es lo que parece. El hecho de que los innings extra muestren un incremento drástico en las carreras permite preguntarse: ¿estamos realmente viendo un aumento real en la ofensiva? O, ¿esto es solo un reflejo de la naturaleza impredecible de los partidos que se extienden más allá de lo previsto?
Además, si eliminamos las circunstancias como los corredores zombis y las entradas lanzadas por jugadores de posición, el panorama se oscurece aún más, llevando a septiembre al decimoséptimo lugar en carreras por partido. Esto invita a una reflexión crítica sobre el impacto de las nuevas reglas en el juego actual. Si bien las reformas pretenden hacer el beisbol más atractivo, se debe preguntar si este es realmente el camino que queremos tomar.
En cuanto a lesiones en las plantillas, hay un doble filo. Aunque la temporada de 2026 terminó sin grandes desbordes de jugadores fuera de acción, refleja la naturaleza imprevista del juego. Ello contrasta con los años previos de plantillas ampliadas y cambios en el manejo de jugadores lesionados. En este contexto, las estadísticas sugieren que los equipos han aprendido a navegar por la incertidumbre de lesiones, pero hay que tener cuidado de no caer en la complacencia.
Y aquí es donde las bases robadas entran como un dato revelador. A pesar de las expectativas de un aumento, las estadísticas mostraron una caída en septiembre, confirmando que el impulso al robo de bases no se ha mantenido en la misma medida. Este estancamiento puede ser preocupante si lo que se busca es revivir el dinamismo del juego.
En resumen, aunque septiembre de 2026 no fue tan deprimente en términos de anotaciones como de costumbre, la subyacente realidad es más matizada. Los números pueden haber subido ligeramente, pero detrás de ellos se esconden patrones preocupantes de lesiones, cambios en el comportamiento de los lanzadores, y una disminución en el juego agresivo en las bases. Si estás en este ámbito, la pregunta a considerar no es solo si el beisbol está mejorando, sino a qué costo.
Discussion
Sign in to join the discussion.